Geometrically speaking
While a was a full-time physics and maths student, i seldom, if ever, thought of proving anything using a diagram, or any kind of non-algebraic method, for that matter. One could make a couple of drawings every now and then to help understanding, but that was all. Not even after learning differential geometry did my view change. As a matter of fact, with the emphasis on (and the beauty of) abstract representations (as in abstract tensor notations), using drawings of surfaces embedded in Euclidean space felt like cheating. To make things even worse, my first serious physics book had been Landau and Lifshitz’s Classical Field Theory, where even words are scarce, let alone drawings or diagrammatic reasoning [1]. In a nutshell, i would have felt at home reading Lagrange’s introduction to his Méchanique Analytic [2]:
No figures will be found in this work. The methods like i set forth require neither constructions nor geometrical or mechanical arguments, but only algebraic operations, subject to a regular and uniform procedure.
[...]
Tensors and birds
Roger Penrose’s thought is all but geometrical, and it comes as no surprise that he has made many a contribution to the physics by drawing camp. Every decent course on General Relativity touches conformal diagrams [6], a nifty method envisioned by Penrose and Brandon Carter (back in the sixties) to bring infinity back into your drawing board. The trick consists on scaling your metric by a global function that vanishes quickly enough when your original coordinates go to infinite. Such scaling is known as a conformal transformation, and has the virtue of preserving angles; in particular, null geodesics are mapped into null geodesics and, therefore, the causal structure (represented by null cones) is untouched. While beautiful and handy, i think that conformal diagrams do not add anything really new from a computational standpoint (as Feynman diagrams do), let alone serving as the basis for actual proofs.
 More
interesting for our current musings is Penrose’s graphical tensor
notation. Tensor indexes (specially in its abstract flavour, also
introduced by Penrose) are a quite convenient housekeeping device,
ensuring almost automatically the consistency of your equations and
even (once one has a bit of practice with them) suggesting their form
[7]. But, convenient as they are, indexes seem to be confusing for
geometrical minds like Penrose’s, who some fifty years ago devised a
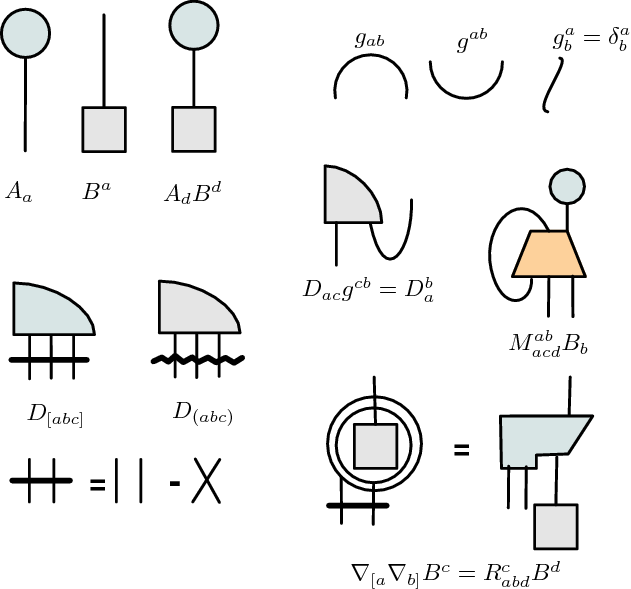
pictorial representation for tensor equations [8]. As you can see in
the figure, the idea is simple: choose a closed polygon to represent
the kernel letter of each tensor, and add an upwards leg for each
contravariant index, and a downwards one for each covariant index.
Index contraction is represented by joining the respective legs. A
wiggly horizontal line represents symmetrisation; a straight one
anti-symmetrisation. One can cross legs to indicate index shuffling.
The metric gets no kernel figure (it’s just an arch), so that
contractions of indexes in the same tensor are easily depicted, and
raising and lowering indexes amounts to twist the requisite leg up or
down. To indicate covariant differentiation, circle the tensor being
differentiated and add the corresponding downwards (covariant) leg. And
so on and so forth. Note also that commutative and associative laws of
tensor multiplication allow your using any two dimensional arrangement
of symbols that fits you, which aids in compactifying expressions.
Penrose explains the many details and twists of the notation in The Road to Reality
and in his (and Rindler’s) Spinors and Space-time I, where you’ll find
extensions to deal graphically also with spinors and twistors.
According to the latter,
More
interesting for our current musings is Penrose’s graphical tensor
notation. Tensor indexes (specially in its abstract flavour, also
introduced by Penrose) are a quite convenient housekeeping device,
ensuring almost automatically the consistency of your equations and
even (once one has a bit of practice with them) suggesting their form
[7]. But, convenient as they are, indexes seem to be confusing for
geometrical minds like Penrose’s, who some fifty years ago devised a
pictorial representation for tensor equations [8]. As you can see in
the figure, the idea is simple: choose a closed polygon to represent
the kernel letter of each tensor, and add an upwards leg for each
contravariant index, and a downwards one for each covariant index.
Index contraction is represented by joining the respective legs. A
wiggly horizontal line represents symmetrisation; a straight one
anti-symmetrisation. One can cross legs to indicate index shuffling.
The metric gets no kernel figure (it’s just an arch), so that
contractions of indexes in the same tensor are easily depicted, and
raising and lowering indexes amounts to twist the requisite leg up or
down. To indicate covariant differentiation, circle the tensor being
differentiated and add the corresponding downwards (covariant) leg. And
so on and so forth. Note also that commutative and associative laws of
tensor multiplication allow your using any two dimensional arrangement
of symbols that fits you, which aids in compactifying expressions.
Penrose explains the many details and twists of the notation in The Road to Reality
and in his (and Rindler’s) Spinors and Space-time I, where you’ll find
extensions to deal graphically also with spinors and twistors.
According to the latter,
The notation has been found very useful in practice as it greatly simplifies the appearance of complicated tensor or spinor equations, the various interrelations expressed being discernable at a glance. Unfortunately the notation seems to be of value mainly for private calculations because it cannot be printed in the normal way.
Besides the (not so obvious nowadays) difficulty mentioned above, i guess that the main hurdle in adopting Penrose’s notation is habit. After many years using indexes, my algebraic mind seldom finds equations confusing because of their indexes. But after a little practice it becomes easier, and i’d say that people who see equations will find it quite natural after a very little while [9]. I don’t know how popular Penrose graphics are among physicists for private use, but there’s many an example of their application and extension to related fields. A few years after its introduction, the notation was rediscovered by Predrag Cvitanović, who used a variation of it in an article on group theory and Feynman diagrams. More concretely, Cvitanović uses diagrams similar to Penrose’s to represent to represent the structure constants of simple groups in the context of non-abelian gauge theories, interestingly linking them with Feynman diagrams (and closing a loop in this article!). Later on, he would use the notation very extensively in his on-line book on Group Theory, where the diagrams go by the name of birdtracks. In a nutshell, the book is devoted to answer, in Cvitanović words, a simple question:
“On planet Z, mesons consist of quarks and antiquarks, but baryons contain 3 quarks in a symmetric color combination. What is the color group?” If you find the particle physics jargon distracting, here is another way to posing the same question: “Classical Lie groups preserve bilinear vector norms. What Lie groups preserve trilinear, quadrilinear, and higher order invariants?”
From here, an amazing journey through the theory of Lie groups and algebras ensues, a journey conducted almost exclusively by diagrams. For, notably, Cvitanović uses his birdtracks (as mentioned, a very evolved kind of Feynman diagrams) to actually derive his results. We have here physics (and maths) by diagrams for real, actually replacing algebraic reasoning (and, incidentally, a proof that Penrose’s reservations about his notation not being apt for publications are unfounded nowadays–i wonder how Cvitanović draws his diagrams).
Before leaving the subject, let me mention a couple more works inspired by Penrose’s diagrammatic notation. Yves Lafont has greatly extended it and carefully analysed its application to mathematical problems in the context of category theory and term rewriting systems. If you’re privy in the field, or simply curious, take a look at his articles Algebra and Geometry of Rewriting (PS) and Equational Reasoning With 2-Dimensional Diagrams , where Yves explores two-dimensional diagrams a la Penrose with an eye to (possibly automatic and computer-aided) derivations much in the spirit of Cvitanović. And, turning back to physics, if there’s a theory prone to diagrammatic reasoning it must be Loop Quantum Gravity, where the basic constituents are graphs and their transformations. Arguably, LQG is the most fundamental example discussed so far of graphical reasoning applied to physics, for here graphs (and their combinations in spin foams, an evolution of another Penrose invention, spin networks) do stand for themselves, as opposed to representing some underlying algebraic mathematical entity. Wandering into the marvels of LQG would carry us too far afield, so i’ll just point out that Rovelli, Smolin and friends use not only Penrose’s spin networks, but, on occasion, also the graphical tensor notation we’ve been reviewing; see for instance their seminal paper Spin Networks and Quantum Gravity, where Rovelli and Smolin presented their famous derivation of exact solutions to the Wheeler-DeWitt equation. The notable thing is, again, the fact that graphic notation is key in many a derivation, and cannot be seen as just an aid to represent some calculations.
[...]
Footnotes
[1] My copy (Spanish translation) of the fifth edition of L&L’s book has 500 pages and just 22 figures!
[2] The link above points to Volume 11 of the collection at Oeuvres de Lagrange, a site that contains what seems to be the complete Lagrange corpus, conveniently scanned and downloadable too.
[3] I would give you a direct link, did it exist. Unfortunately, PI’s website is not up to the quality of their other activities. You’ll find it by browsing to their Public Lectures Series and from there to page 2 (or search for James Brown). Another very unfortunate circumstance is that the videos are only available for those of you not using weird as in freedom operating systems :-(.
[4] That’s at least my impression. Penrose, for instance, advocates for their reality in his road. The subject is however controversial enough to grant the existence of monographs like the recent Drawing theories apart, by David Kaiser (which i cannot comment on since i’ve just added it to my wish list).
[5] But i find this argument hard to swallow. Think for instance in the interpretation of antiparticles as particles travelling backwards in time: it also follows naturally (for some definition of natural) from perturbative series and/or their diagrams, but it is not as easily accepted as the existence of virtual photons. One wonders, where’s the limit?
[6] If you haven’t your favourite textbook at hand (Hawking and Ellis being mine when it comes to anything related to causal structure), you can find a pretty good introduction on-line in this chapter of Sean Carroll’s lecture notes.
[7] There is only so many ways of combining indexes, and if you know what are the free ones on, say, your LHS and the tensors entering the RHS and its general properties (e.g. symmetries), it’s often an easy task how their indexes should be combined. It reminds me, in a way, of dimensional reasoning, where knowing the target units and the ingredients gives an often quite accurate clue of how to combine them.
[8] It was introduced in a chapter of the book Combinatorial Mathematics and its Applications (Academic Press, London, 1971), entitled Application of Negative Dimensional Tensors. But Penrose have been using it (according to this letter to Cvitanović (PDF) since 1952.
[9] An interesting (and not too far fetched) software project would
be to write a Penrose diagram editor, possibly with support for tablet
input devices. Such a tool would also probably solve the publication
issue. In an ideal world, one would use a stylus to draw equations
which would get automatically imported as nice diagrams, regular tensor
equations with indexes or both. Any takers? ![]()

July 6th, 2006 at 6:06 pm
Some quick, preliminary and maybe superficial remarks on this long and interesting post:
1. I would indeed not be too quick in dismissing the value of ‘proof by drawing’: one could say that drawings form just another kind of notation, bearing in mind that ’seeing’ the truth of a reasoning is still of key importance in an algebraic proof: everyone will remember those kind of students that can’t ’see’ the logic or (deductive) truth of a mathematical proof. In such kind of proof or reasoning the different steps are more ‘laid out’ one could argue, but they are so in an algebraic way, and one has to see the logical and algebraical connections. With drawings, one also has to make logical, but now figurative connections, relations and manipulations, and one could say that the mind does this more easily - but maybe mostly unaware of the manipulations the mind exercises. The intellectual, conscious aspect of a - by definition - laid-out algebraic proof could be a reason why professionals tend to prefer them above drawings, which are ‘direct’, ‘easy’ and maybe even considered ‘childish’.
2. The correct formula for the top right hand figure is 1+3+…+(2n minus 1) = n^2 in which 2n-1 is the number (of blocks) added to the previous number (of squares). One can of course prove this equation algebraically, but the reason why it is correct one can only see by means of the diagram.
This points to and follows from the geometrical foundations of mathematics.
July 6th, 2006 at 8:31 pm
Kristo, thanks for the correction, i’ve updated the figure. As for your interesting comments, i mostly agree with them. However, my feeling is that we live in the tradition of Hilbert and Russell and tend to trust a proof only when it’s symbolic. Drawings and figures, in this tradition (prejudice?) feel more as heuristic devices, somehow not to be trusted in the same degree as an algebraic derivation… there’s something elusive (i’m tempted to say, artistic) in geometric reasoning. At least this is how i feel, as a result, no doubt, of my (mathematical) education, and that’s why i find both surprising and refreshing entire demonstrations carried out, almost exclusively, in a geometric way. But, as i said, this may well be just prejudice. For instance, Newton’s Principia are mostly geometrical and i think (correct me if i’m wrong) that Newton consciously avoided more synthetic expositions based on his underlying calculus with fluxions and infinitesimal quantities, because he regarded geometrical proofs more solid. So i wonder, is it just a fad of the times one happens to live in, or is there an approach inherently more fundamental? Do you trust equally algebraic and geometrical proofs?
As an aside, my feeling is that i can also see why the sum you corrected is true algebraically, the figure providing just reassurance in concrete cases for the general result. But i suspect that this is due to prejudice and education!
July 9th, 2006 at 4:32 am
Well IMHO, the geometric demostration of the mentioned sum is crystal clear, but the algebraic procedure in the long run turns out to be much more powerful take as an example the Poisson formulas for complex geometric series, and at least for me it is also very clear to see why the series is converging using the algebraic proof. The good thing is that both approaches are complementary allowing us to gather new insight that might be hard or even impossible to gather otherwise.
July 11th, 2006 at 7:42 am
Jao, a word of encouragement for you:
I think this might be the best blog I’ve ever come across. I found you in Christine’s links and this post is a good example of what I’m loving about your blog. You seem to have been quite prolific with posting and hopefully will continue to be so.
I’ll certainly be spreading word about this place as far and wide as I can. Hopefully, you’ll start getting the traffic and comments you deserve because I can say unjokingly that the posts here are among the best I’ve read.
A new fan
-rick
July 11th, 2006 at 12:03 pm
Rick, thank you for your kind words, which are definitely encouraging. It is very rewarding to know that someone enjoys reading these posts as much as i enjoy writing them. I rarely plan my posts, so that their frequency depends largely on what i stumble upon. Fortunately, our field is full of occasions for stumbling, and i hope i’ll be posting regularly for quite a long time… specially with comments as yours
Thanks again!
July 19th, 2006 at 6:32 pm
[…] Not to be outdone, jao at physics musings has some musings about physics diagrams. Feynman’s, of course, but also these funny pictures invented by Penrose to represent tensor algebra (pictured right). (Not sure what to call them, as “Penrose diagrams” is already taken.) They are a cute way of keeping track of the index gymnastics of ordinary tensors. I’m not sure if they actually represent an advance over the indices (of which I’m quite fond), but if nothing else they provide an interesting insight into the mind of someone smarter than most of us. […]
July 19th, 2006 at 7:28 pm
Great, great post!
July 19th, 2006 at 8:17 pm
About Penrose’s diagrammatic notation (that I like to call “braiding knotation”), we mathematicians use it aswell! Not only for that Cvitanović group stuff, but also as a convenient way of dealing with monoidal categories, where you cannot write your equations elementwise. This graphical notation was heavily used in the early 90’s by many people, including Turaev and Majid.
I use them myself for describing generalized tensor products of algebras, since they allow to describe topologically some equations required for ensuring associativity. By the way, I draw those diagrams through a set of “building bricks” macros designed for working with LaTeX and XY-pic. You may give them a look at this paper: math.QA/0511280
If anyone is really interested on them, I can send you the macros source file (they are a bit of a resource hog, though).
All the best
Javier
July 20th, 2006 at 7:31 am
I like this post : )
Pedant remark though.. it’s “Oeuvres de Lagrange”, not “Ouvres de Lagrange” ; )
July 24th, 2006 at 10:29 pm
One thing that previous posts haven’t touched on is that it’s generally much easier to `prove something rigorously’ once you have something that you (a) think is quite likely to be true and (b) the `fundamental idea’ behind why it’s true, than it is to come up with those two in the first place. So I think the interesting question about diagrammatic notation as opposed to `glyph-based’ notation is whether in some cases it abstracts away irrelevant details better, so that you can see the patterns easier. (Indeed this is in the quote from Penrose:
the various interrelations expressed being discernable at a glance.
) I know that working with standard equations (ie, glyphic stuff) sometimes due to a bad choice of variable names it’s taken me longer to spot some useful symmetry because the symmetry was `spoiled’ by the variable names; maybe diagrammatic notation is less prone to this?
July 27th, 2006 at 5:42 am
Found this post via the link at CV. Cool stuff.
I went to the first day of a four-day
classtalk about diagrammatic logic: generalizing tensor indices to arbitrary variables, we can have, most basically, polygons representing relationships. A box with one line might represent “P(x) is true”; a box with two lines could be a function or a more general relationship between two objects. (And perhaps we might label lines with what kinds of objects they take as variables.) Then the existential quantifier in this diagrammatic second-order logic is exactly a node with an edge. Equality of n objects is a node with valence n. And instead of trying to sum a closed expression the way tensors do, evaluations should be either True or False. (Or, more generally, some “truth values” in whatever logical system you decide to work in.)There is, of course, the necessity of a non-local (and oriented) “not” operator, expressed in this notation as a Jordan curve around the expressions. This, of course, requires that there be certain relationships (like that after symmetrizing, crossing two edges doesn’t do anything, or that g_{ab}g^{bc} = \delta_a^c) between, e.g. nodes and negations.
Another note: for quite a while, so goes the physics lore, theorists thought that Feynman diagrams were it — that everything was exactly expressible as a sum of Feynman diagrams. But then non-perturbative solutions were found: QFTs admit events that Feynman diagrams cannot detect or represent. There’s more going on in nature.